
Correlation Matrix of input features
- Jun 9, 2020
- 2 min read
About Correlation:
What is Correlation Coefficient?
The correlation coefficient (ρ) is a measure that determines the degree to which two variables’ movements are associated.
For what purpose they are used for?
Correlation coefficients are used to measure the strength of the relationship between two variables.
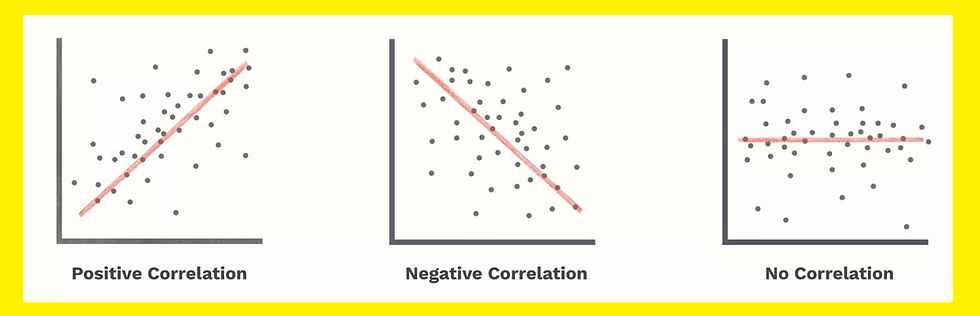
What is Positive and Negative correlation means?
Positive: If two variables/features lets say feature 1 and feature 2 are positively correlated then it means if feature 1 increase then feature 2 also increases (i.e. same direction)
Negative: negatively correlated features will move in opposite directions
How to calculate correlation coefficient?
To calculate correlation, one must first determine the covariance of the two variables in question. Next, one must calculate each variable’s standard deviation.
The correlation coefficient is determined by dividing the covariance by the product of the two variables’ standard deviations.
Standard deviation is a measure of the dispersion of data from its average.
Covariance is a measure of how two variables change together, but its magnitude is unbounded, so it is difficult to interpret.
By dividing covariance by the product of the two standard deviations, one can calculate the normalized version of the statistic. This is the correlation coefficient.
For the linear relation we can use the Pearson product-moment correlation:
The most common correlation coefficient, generated by the Pearson product-moment correlation, may be used to measure the linear relationship between two variables.
However, in a non-linear relationship, this correlation coefficient may not always be a suitable measure of dependence.
It is important to note following points regarding Correlation coefficient:
With small samples, correlations can be unreliable. (In academic research, a common rule of thumb is that when p is greater than 0.05, the correlation should not be trusted)
A single unusual observation (outlier) can make the computed correlation coefficient highly misleading with small samples, correlations can be unreliable.
Correlations show only the extent to which one variable can be predicted by another, and they do not pick up situations where the difference in the predictive values is too small to be considered useful
It summaries the linear relationship, and if the true relationship is nonlinear, then this may be missed
Very high correlations often reflect tautologies rather than findings of interest
Causation Vs Correlation in Statistics:
It important to note that:
Causation indicates that an event affects an outcome.
Correlation doesn’t necessarily imply causation. An association or correlation between variables simply indicates that the values vary together.
It does not necessarily suggest that changes in one variable cause changes in the other variable.
Methods to find out correlation in Python:
We will take a look at following 3 of the techniques to find the correlation between the features:
Pandas corr():
To find the pairwise correlation of all columns in the data frame
Any na values are automatically excluded
For any non-numeric data type columns in the data frame it is ignored
Now we will take a look at the outputs of the Example having input features as follows:

method=’pearson’

method =’kendall’

method=’spearman’
For the code implementation and the output please refer this GitHub repository
This is it for now. We have seen Correlation and also how calculate it in python. If you have any questions regarding it please feel free to ask in the comment section.
Also if you like my article please like and subscribe to my blog.


Comments